Myth #1: High Blood NEFA & BHBA Are Bad For The Cow
Because of the extensive evidence for potential negative outcomes associated with elevated NEFA and BHBA, several large epidemiological studies have been conducted to identify a critical blood concentration in which negative effects may be expressed in transition cows. Since BHBA are far more commonly measured than NEFA, it has been the focus of many of these studies. The studies are fairly consistent in suggesting that 1.2-1.4 mmol BHBA/L is the point in which milk production is likely to be reduced. Consequently, it is commonly recommended that if 10-15% or greater of the cows tested are at 1.2 (or 1.4) mmol BHBA/L or above, an alarm level has been reached and causes should be identified.
BACKGROUND
Beginning at calving and through early lactation, cows will mobilize energy from fat tissue (Figure 1). The triglyceride within fat stores is broken down to glycerol and nonesterified fatty acids (NEFA). NEFA leaves fat tissue and enters the bloodstream. We know that approximately 25% of these NEFA are taken up by the liver. Ideally, all NEFA would be completely oxidized in the liver to provide energy for the cells or be transferred to the udder of the cow to support lactation. However, during times of elevated NEFA uptake, some NEFA are converted back to triglyceride and stored in the liver or are incompletely oxidized to ketones such as beta-hydroxybutyrate (BHBA). The research literature is extensive as to potential negative effects when blood NEFA and/or BHBA become too high. Potential negative effects include depressed dry matter intake, chronic inflammation, decreased immune function, oxidative stress, decreased pregnancy rates, impaired glucose production by the liver, increased risk of displaced abomasum, and development of fatty liver and ketosis. However, it is important to keep in mind that NEFA and BHBA also have extremely useful functions, namely, they are an energy source for tissues including the mammary gland, and they serve as precursors for milk fat synthesis.
*FIGURE 1
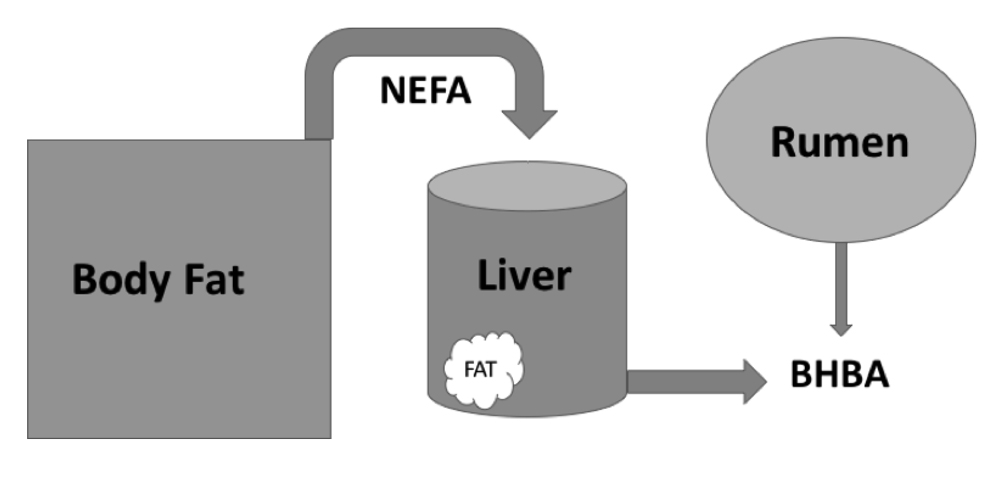
BUSTING THE MYTH: HIGH BLOOD NEFA AND BHBA SUPPORT LACTATION AND ARE NOT NECESSARILY BAD
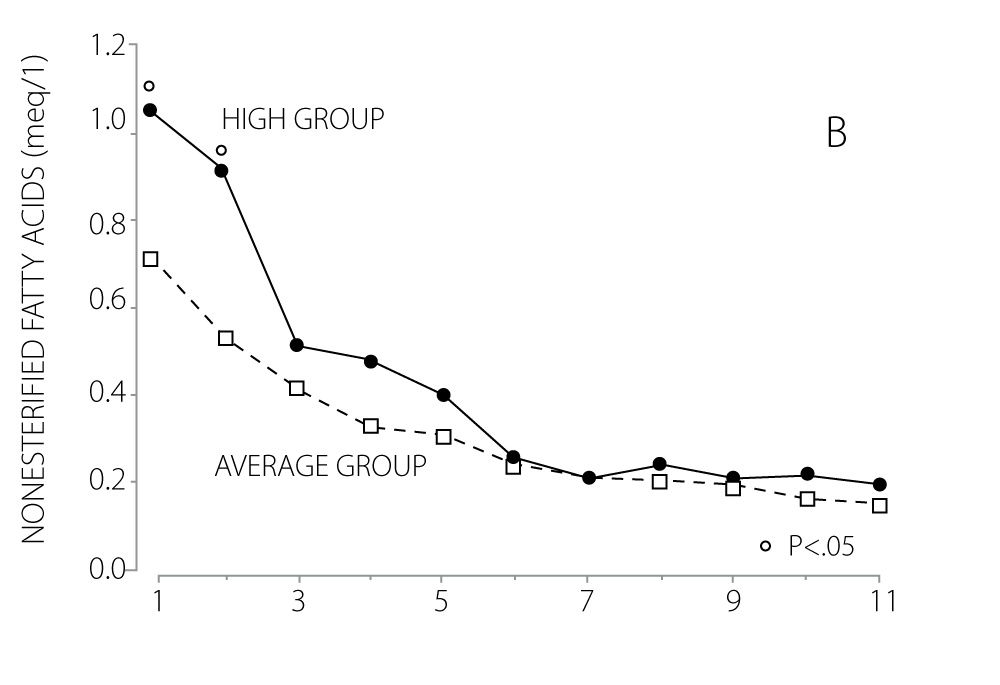
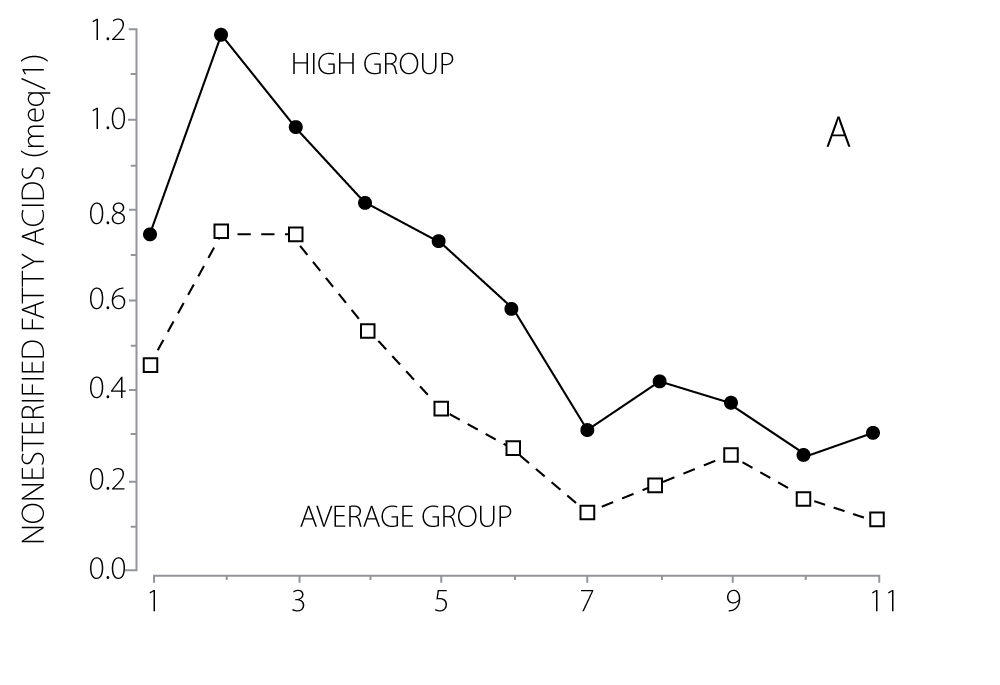
Hand held meters are available to easily test cows blood and receive numerical values for blood BHBA, hence the frequency of testing has increased dramatically and is common place on dairy farms. The increased testing has resulted in an increased frequency of a question from dairy producers: “More than 15% of my cows are testing above 1.2, but my cows are milking like crazy. Should I be concerned?” The epidemiological studies suggest they should be, but let’s take a closer look. An extensive multi-university study resulted in two genetic lines of cattle, those resulting from breedings using high genetic merit semen vs. those that resulted from breedings using semen of average genetic merit. After decades of creating these two genetic lines, data was summarized (Figure 2, 3 & 4; Harrison et al., 1990). Use of high genetic semen resulted in cows that produced 12 lb more milk per day and the higher milk production started immediately after calving. FCM production was also dramatically different between the two treatments. However, dry matter intake did not differ between the two groups until four weeks after calving. Consequently, high genetic cows had higher blood NEFA and BHBA during that period of time. More recent studies (Vanholder et al., 2015; Rathburn et al., 2017) have also suggested that cows testing above 1.2 mmol BHBA/L have higher milk production than those testing below that level. How can this data be reconciled with the results from large epidemiological studies cited above? Keep in mind that epidemiological studies were conducted using very large animal and herd numbers. Consequently, the conclusions from those studies probably apply to the average cow or herd. It is quite likely that the 1.2 mmol BHBA/L value is a good cut-point in general, but it might not be appropriate for all herds, particularly those that have genetically superior cows.
*FIGURE 2
Average daily milk production (A) and 4% FCM (B) for high and average producing cows.
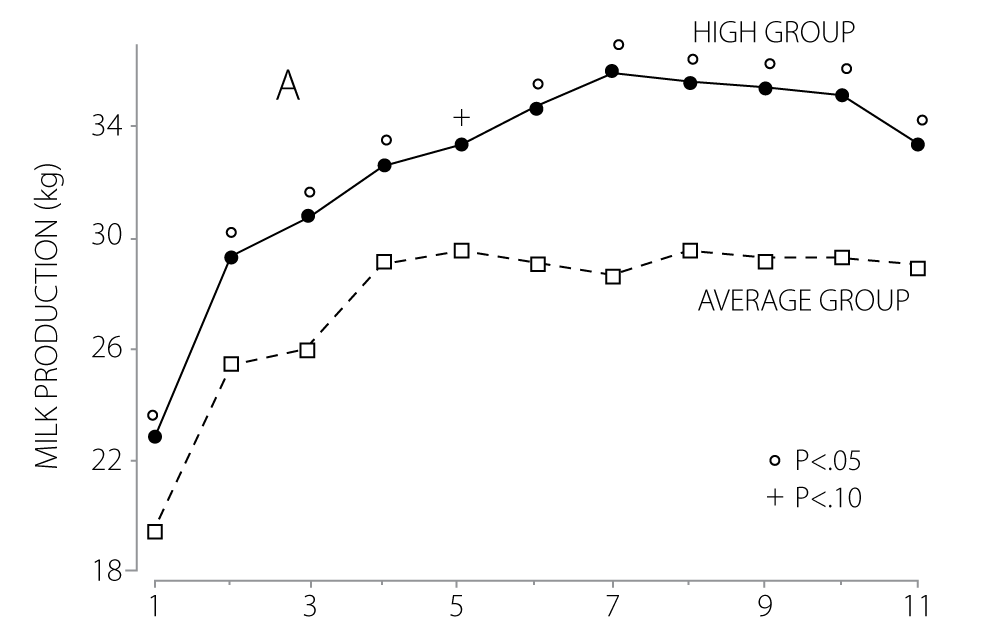
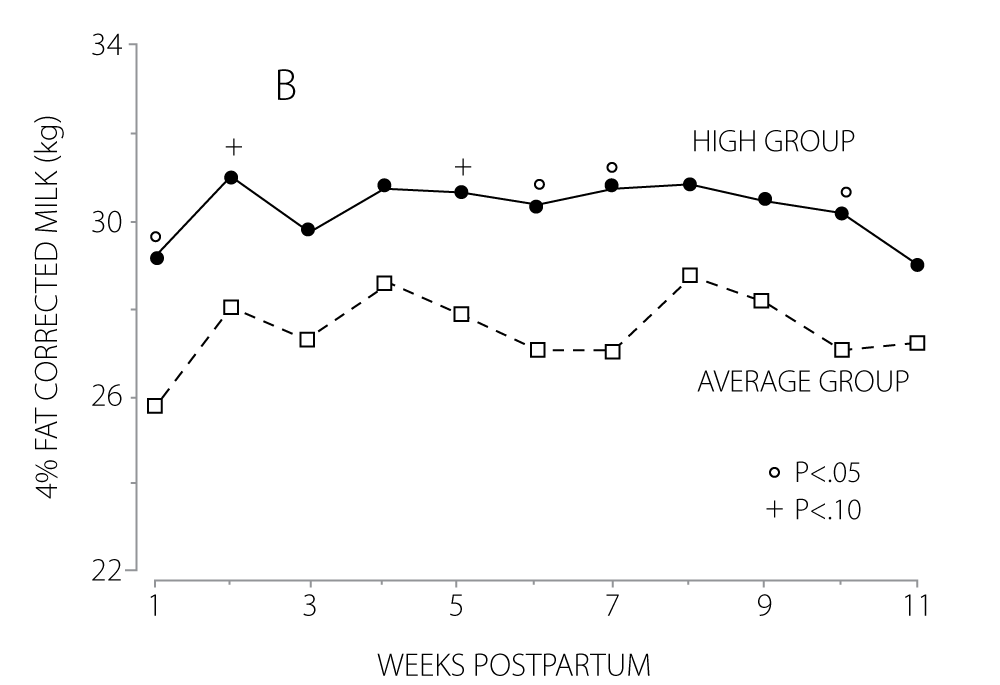
*FIGURE 3
Average daily energy balance (A) and feed intake as a percentage of BW (B).
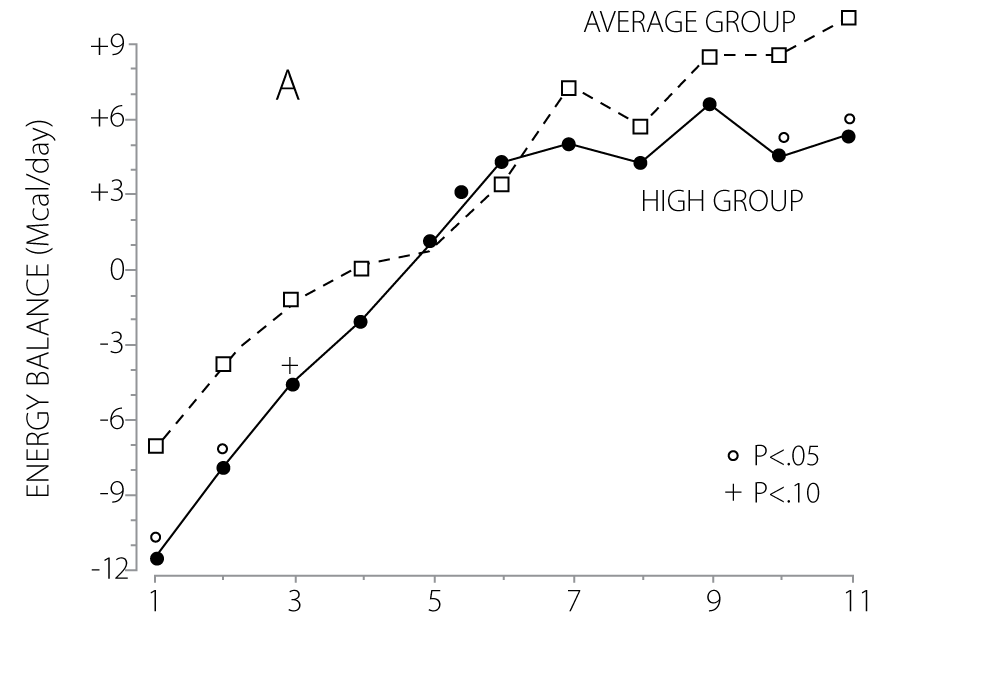
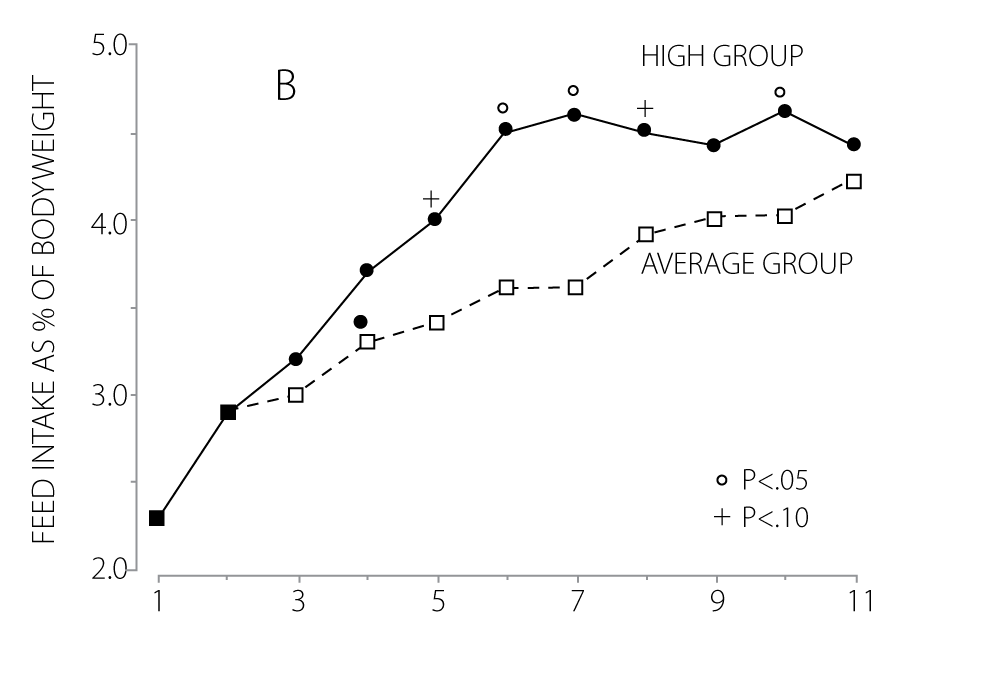
*FIGURE 4
Average daily energy balance (A) and feed intake as a percentage of BW (B).
TAKE HOME MESSAGE
If cows are milking like crazy and testing above the alarm level, and they do not have other issues (e.g., low reproductive performance, high incidence of displaced abomasums), RELAX! This does not mean that BHBA testing isn’t useful. We all would like blood tests that are black and white in their interpretation (e.g. a standard cut point) but that is seldom the case. BHBA testing can be a useful tool, particularly if it is being used to monitor changes within a herd that might be indicative of changes on the farm that could negatively affect herd performance. For example, trends towards higher BHBA may be symptomatic of changes to lower forage quality, increased stocking density, elevation of internal body fat that isn’t detected by condition scoring, etc.
Sources
HARRISON, R. O., S. P. FORD, J. W. YOUNG, A. J. CONLEY, AND A. E. FREEMAN. 1990.
Increased milk production versus reproductive and energy status of high producing dairy cows. J. Dairy Sci. 73:2749-2758.
RATHBUN, F. M., R. S. PRALLE, S. J. BERTICS, L. E. ARMENTANO, K. CHO, C. DO, K. A. WEIGEL, AND H. M. WHITE. 2017.
Relationships between body condition score change, prior mid-lactation phenotypic residual feed intake, and hyperketonemia onset in transition dairy cows. J. Dairy Sci. 100:3685-3696.
VANHOLDER, T., J. PAPEN, R. BEMERS, G. VERTENTEN, AND A. C. B. BERGE. 2015.
Risk factors for subclinical and clinical ketosis and association with production parameters in dairy cows in the Netherlands. J. Dairy Sci. 98:880–888.
OVERTON, T. R., J. A. A. MCART, AND D. V. NYDAM. 2017.
A 100-year review: Metabolic health indicators and management of dairy cattle. J. Dairy Sci. 100:10398-13054.
